Release Performance Summary
The Release Performance Summary in Visibility Reports shows you data on your most recent releases. The default list goes back 365 days, but simply adjust the date filter to see releases distributed up to four years prior to today's date.
 |
Release Performance Summary |
Detailed Breakdown of Features
 |
Recent reports |
See your most recent releases at a glance, along with all multimedia assets distributed with them.
 |
Key data - stat tiles |
Top level statistics reflecting the last 365 days of release activity via PR Newswire.
- Pickup -- Total pickup represents all relevant media placements and influencer interaction around your content, consisting of either exact match pickup from the online and social media that we monitor or tweets about your news.
- Views and Hits -- total number of views and web crawler hits to your releases on our websites and online network
- Multimedia -- total number of views to multimedia assets distributed with your releases
- Engagement -- total number of times audiences engaged with your content on our websites over the last 365 days. Web Conversions will also be included if purchased with Premium Visibility - Reports Impact Audience plus Web Conversions
 |
Release Summary |
Key release data are highlighted upfront, with a carousel display of all multimedia assets distributed with each release.
Columns break out top level statistics for each release, allowing for easy, at-a-glance comparison. Pickup totals, views and hits, multimedia views and engagement statistics displayed for each release.
- Click the magnifying glass to see your release on our website.
- Click any headline to see comprehensive reporting details for your release in the Release Performance section
- Click the check boxes to compare deeper-level data for up to three releases.
Search releases by date
Easily search recent releases by choosing 12 Months, This Year, This Week, or This Month. Or set a Custom Date Range: enter a start and end date, then click the 'Search' button; the default view shows the last 365 days; releases are searchable within the last 4 years.
Search releases by organization name
If you're an agency or a company with multiple divisions, easily segregate your reports by company or organization.
 |
Visibility Reports - Filter Options |
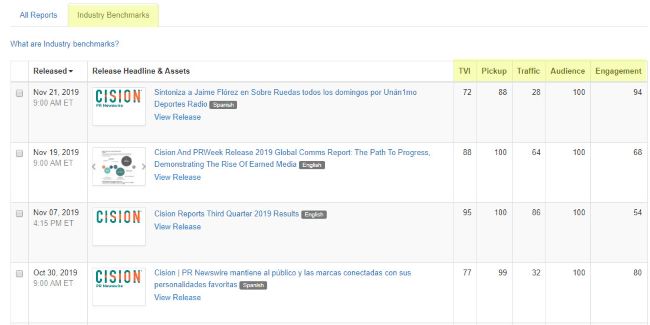 |
This table shows metrics that allow a comparison of your releases to other similar releases distributed by PR Newswire.
*Note: Currently this is available for releases that post on prnewswire.com only. At this time, PRWeb releases will not display Industry Benchmarks.
-
What is the Total Visibility Index or TVI?
Total Visibility Index (TVI) is an indication of how the visibility of your news release compares with that of other releases issued by PR Newswire within the same industry. The index is compiled by assessing the performance of your releases in three key areas: Pickup, Audience and Traffic, and comparing your numbers with those of generally similar releases. It is useful to look at each of these categories separately and see how a your release doing in each sector. A score of above fifty indicates that your release is doing better than other releases in the same industry.
-
What is the Engagement Index or EI?
PR Newswire's Engagement Index (EI) allows you to keep tabs on audience activity generated by your press release. "Your Engagement benchmark compares reader interaction with your release on PR Newswire's website (e.g. printing, emailing, sharing, etc.) as compared to interaction statistics for other releases issued by PR Newswire within your industry. The scale is set from 0-100, with 50 always being the industry average.
-
How do we calculate Industry Benchmarks?
We compare data for releases we distributed recently in every industry and divide the full spectrum of metrics into 100 equal bands or percentiles. Each of your releases is then compared to those percentiles on an ongoing basis and the Industry Benchmark represents the percentile given to your release. For example, if a release's Industry Benchmark for Traffic is 50 then it is in the top 50% of all releases in the same industry. If the Industry Benchmark is 100 then the release is in the top 1%.
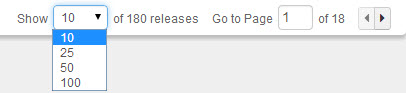 |
Easily see up to 100 releases per page, or navigate to pages using the arrow key.
 |
Cision - U.S. Customers
+1-888-776-0942
HelpDesk@cision.com
Cision - EMEAi Customers
+ 44 (0)207 454 5111
release@prnewswire.co.uk
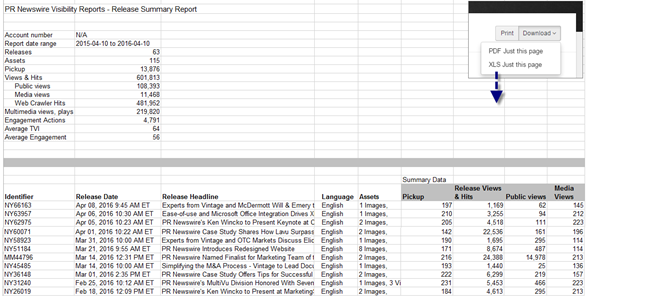
Print or save (as a PDF or Excel file) any page of your Visibility Reports by clicking the Print or Save icons at the top; you can also email any individual report by clicking the Email button at the top of the page.
Click the View All link whenever you see it to view the full, expanded data set within that metric.